
Ncert Solutions For Class 6 Maths Chapter 9 Data Handling Class 6 Maths Chapter 9 Data Handling Chapter 9 Data Handling Class 6 Chapter 9 Data Handling Chapter 9 Data Handling Class 6 Class 6th Maths Chapter 9 Exercise 9.2 Ncert Maths Class 6 Chapter 9 Exercise 9.4 Class 6 Maths Data Handling Exercise 9.3 Ncert Maths Class 6 Chapter Data Handling
NCERT Solutions for Class 6 Maths Chapter 9 Data Handling Ex 9.4
Question 1.
A survey of 120 school students was done to find which activity they prefer to do in their free time:
| Preferred activity | Number of students |
| Playing | 45 |
| Reading story books | 30 |
| Watching T.V. | 20 |
| Listening to music | 10 |
| Painting | 15 |
Draw a bar graph to illustrate the above data taking the scale of 1 unit length = 5 students.
Which activity is preferred by most of the students other than playing?
Solution.
(i) Draw two perpendicular lines—one vertical and one horizontal.
(ii) Along horizontal line mark the “Preferred activity” and along vertical line mark the “No. of students”
(iii) Take bars of same width keeping the uniform gap between them.
(iv) Take scale of 1 unit length = 5 students along the vertical line and then mark the corresponding values.
(v) Calculate the heights of the bars for various activities preferred as shown below :
Playing : 45÷5= 9 units
Reading story books : 30÷5= 6 units
Watching T.V. : 20÷4 =4 units
Listening to Music : 10÷5= 2 units
Painting : 15÷5=3 units
(vi) Now draw various bars.
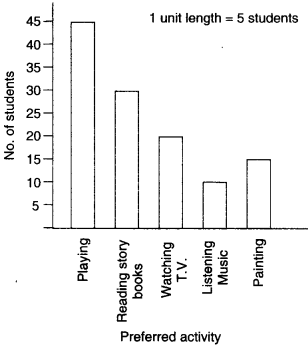
The activity “Reading story books” is preferred by most of the students other than playing.
Question 2.
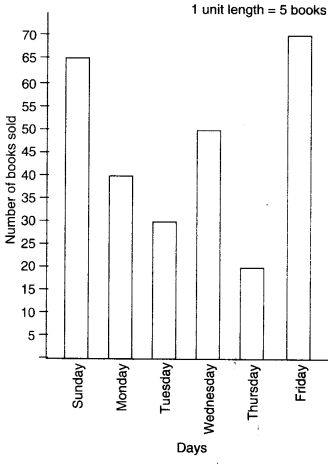
The number of Mathematics books sold by a shopkeeper on six consecutive days is shown below:
| Days | Sunday | Monday | Tuesday | Wednesday | Thursday | Friday |
| Number of books sold | 65 | 40 | 30 | 50 | 20 | 70 |
Draw a bar graph to represent the above information choosing the scale of your choice.
Solution.
(i) Draw two perpendicular lines—one vertical and one horizontal.
(ii) Along horizontal line mark the “days” and along vertical line mark the “number of books sold.”
(iii) Take bars of same width keeping the uniform gap between them.
(iv) Take scale of 1 unit length = 5 books along the vertical line and mark the corresponding values.
(v) Calculate the heights of the bars for various days as shown below:
Sunday : 65÷5=13 units
Monday : 40÷5=8 units
Tuesday : 30÷5=6 units
Wednesday : 50÷5=10 units
Thursday : 20÷5=4 units
Friday : 70÷5=14 units
(vi) Now draw various bars.
Question 3.
Following table shows the number of bicycles manufactured in a factory during the years 1998 to 2002. Illustrate this data using a bar graph. Choose a scale of your choice.
| Year | Number of bicycles manufactured |
| 1998 | 800 |
| 1999 | 600 |
| 2000 | 900 |
| 2001 | 1100 |
| 2002 | 1200 |
(i) In which year was the maximum number of bicycles manufactured?
(ii) In which year was the minimum number of bicycles manufactured?
Solution.
Steps for drawing a bar graph
(i) Draw two perpendicular lines — one vertical and one horizontal.
(ii) Along horizontal line marks the Year and along vertical line mark the “No. of bicycles manufactured”.
(iii) Take bars of same width keeping uniform gaps between them.
(iv) Take scale of 1 unit length = 100 bicycles along the vertical line and then mark the corresponding values.
(v) Calculate the heights of the bars for various years as shown below:
1998: 800÷100=8 units
1999: 600÷100=6 units
2000: 900÷100=9 units
2001: 1100÷100=11 units
2002: 1200÷100=12 units
(vi) Now draw various bars.
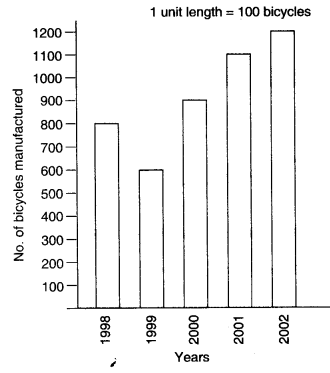
(i) The maximum number of bicycles were manufactured in the year 2002.
(ii) The minimum number of bicycles were manufactured in the year 1999.
Question 4.
A number of persons in various age groups in a town is given in the following table:
| Age group | Number of persons |
| 1-14 | 2 lakhs |
| 15-29 | 1 lakh 60 thousand |
| 30-44 | 1 lakh 20 thousand |
| 45-59 | 1 lakh 20 thousand |
| 60-74 | 80 thousand |
| 75 and above | 40 thousand |
Draw a bar graph to represent the above information and answer the following questions. (take 1 unit length = 20 thousands):
(i) Which two age groups have the same population?
(ii) All persons in the age group of 60 and above are called senior citizens. How many senior citizens are there in the town?
Solution.
(i) Draw two perpendicular lines — one vertical and one horizontal.
(ii) Along horizontal line mark the “Age group” and along vertical line mark the “Number of persons”.
(iii) Take bars of same width keeping uniform gap between them.
(iv) Take scale of 1 unit length = 20 thousand along the vertical line and then mark the corresponding values.
(v) Calculate the heights of the bars for various of groups as shown below:
1- 14 : 20000020000 =10 units
15- 29 : 16000020000 = 8 units
30- 44 : 12000020000 = 6 units
45- 59 : 12000020000 = 6 units
60- 74 : 8000020000 = 4 units
75 and above : 4000020000 = 2 units
(vi) Now draw various bars.
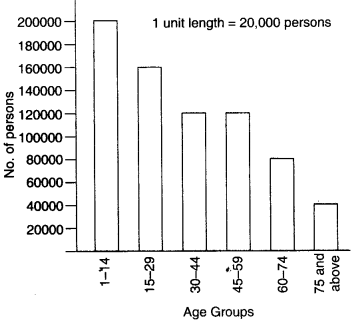
(i) The two age-groups 30-44 and 45-59 have the same population.
(ii) Number of senior citizens in the town
= 80000 + 40000
= 120000
Question 1
Observe the given bar graph and answer the questions.
Suppose the graph represents the number of students in different classes.
| Class | Number of Students |
|---|---|
| VI | 40 |
| VII | 35 |
| VIII | 50 |
| IX | 45 |
(a) Which class has the maximum number of students?
Solution
From the graph:
- Class VIII has 50 students.
Answer
5050
Class VIII has the maximum number of students.
(b) Which class has the minimum number of students?
Solution
From the graph:
- Class VII has 35 students.
Answer
3535
Class VII has the minimum number of students.
(c) Find the difference between the students of Class VIII and VII.
Solution
50−35=1550 – 35 = 15
Answer
The difference is:
1515
Question 2
Draw a bar graph for the following data.
| Fruit | Number |
|---|---|
| Apples | 20 |
| Mangoes | 35 |
| Oranges | 25 |
| Bananas | 30 |
Solution Steps
- Draw horizontal and vertical axes.
- Write fruit names on the horizontal axis.
- Mark numbers on the vertical axis.
- Choose a suitable scale.
- Draw bars of equal width.
The heights of bars represent the quantities of fruits.
Importance of Bar Graphs
Bar graphs help to:
- Compare data quickly
- Understand information visually
- Present data neatly
- Analyze trends easily